Demo
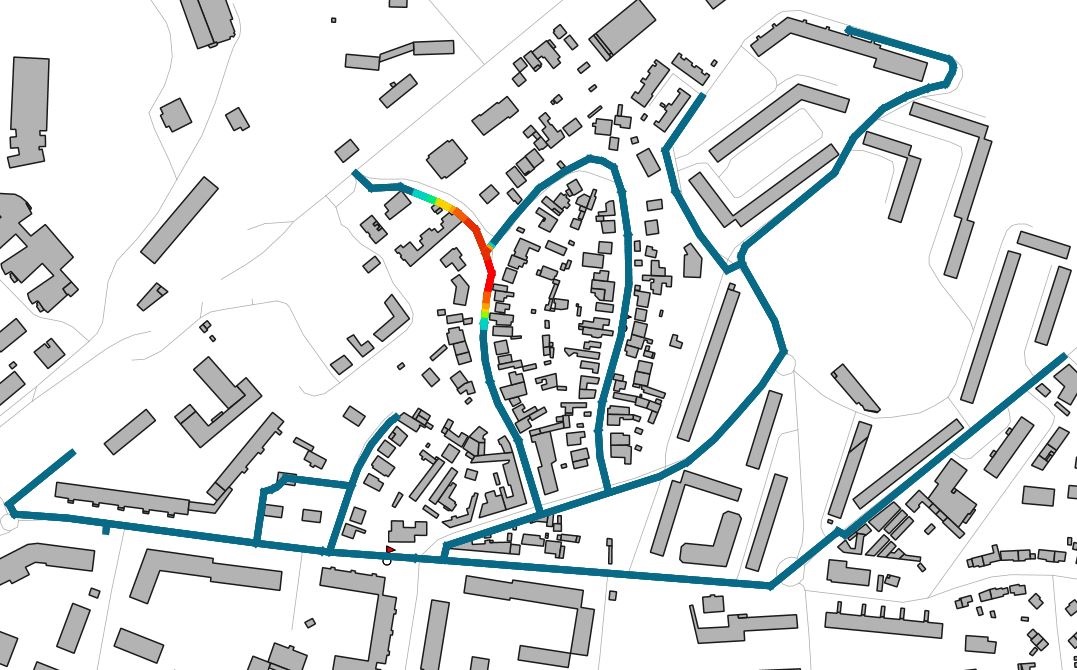
Water network
Information about water quality such as velocity, pressure and chemical concentration can be used to detect leaks and to control the concentration of chlorine or other chemical products in the network.
Demo
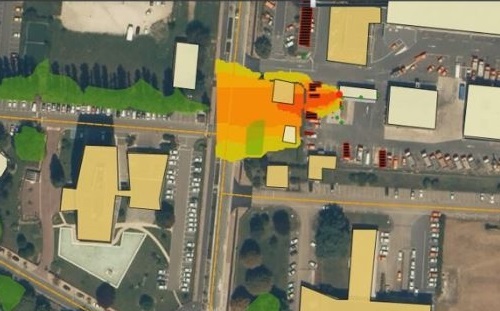
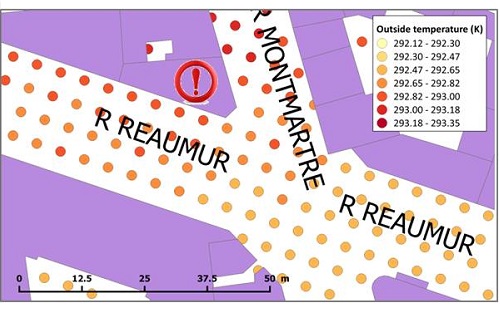
Urban heat wave
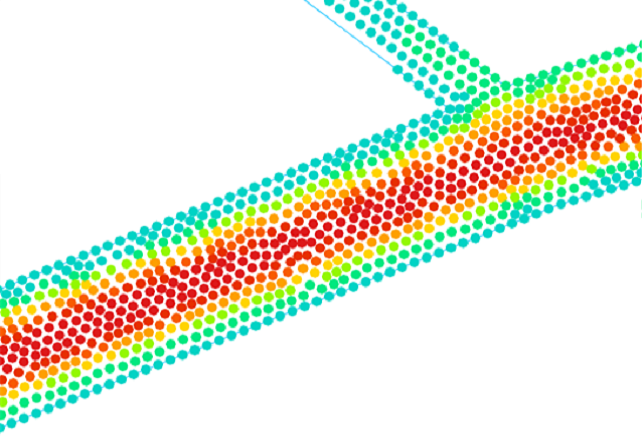
Representation of heat wave and dangerousness estimation according to its duration, intensity and demographic data.
Découvrir
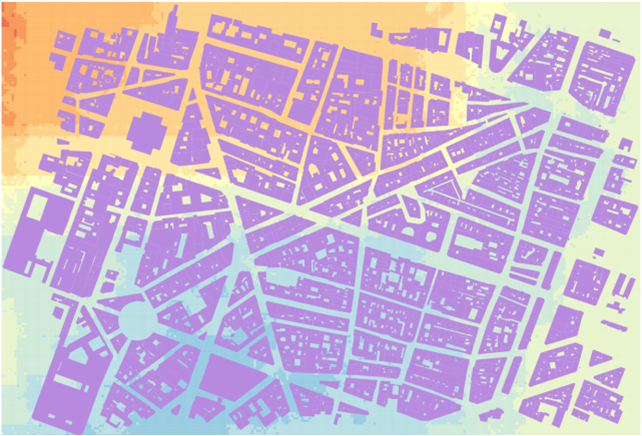
Representing Urban Phenomena in Their Context and at Different LoD: from Raw Data to Appropriate LoD.
Découvrir
Reconstruction de l'objet canicule : modélisation et représentation graphique.
Découvrir
Symbolization and generalization to map water pipe data flow and water quality at different scales.
Découvrir
Une meilleure connaissance et estimation du risque caniculaire en zone urbaine dense.
Découvrir
Apport de la géomatique pour l’analyse et la représentation du risque caniculaire.
IFSTTAR
14-20 Boulevard Newton
Cité Descartes, Champs sur Marne
77447 Marne la Vallée Cedex 2, France.